Prometheus 介绍与使用
架构与组件

- Pormetheus server
- 核心
- 抓取并存储时序数据
- Exporters
- 数据收集器
- 提供各种客户端
- 支持自定义接入
- PushGateway
- push 方式收集指标数据
- 适用短生命周期的程序,比如计划任务等
- AlertManager
- 处理告警信息
- 发送/静默/禁止/聚合
- 配置告警发送
- WebUI
- 查看当前告警
- 查看所有规则
- 查看所有收集目标
- 查询指标
Prometheus
配置文件示例
yaml
global:
  scrape_interval:     15s # Set the scrape interval to every 15 seconds. Default is every 1 minute.
  evaluation_interval: 15s # Evaluate rules every 15 seconds. The default is every 1 minute.
  # scrape_timeout is set to the global default (10s).

# Alertmanager configuration
alerting:
  alertmanagers:
  - static_configs:
    - targets: ['localhost:9093']

# Load rules once and periodically evaluate them according to the global 'evaluation_interval'.
rule_files:
  - "rules/*.yml"

# A scrape configuration containing exactly one endpoint to scrape:
# Here it's Prometheus itself.
scrape_configs:
  # The job name is added as a label `job=<job_name>` to any timeseries scraped from this config.
  - job_name: 'prometheus'

    # metrics_path defaults to '/metrics'
    # scheme defaults to 'http'.

    static_configs:
    - targets: ['localhost:9090']

  - job_name: 'node'
    file_sd_configs:
    - files:
      - 'targets.json'

  - job_name: 'rds'
    static_configs:
    - targets: ['localhost:9500']

  - job_name: 'redis'
    static_configs:
- targets: ['localhost:9600']检测配置/规则文件
- 检测配置文件bash
./promtool check config prometheus.yml - 检测规则文件bash
./promtool check rules rules/ecs.yml
告警规则
https://prometheus.io/docs/prometheus/latest/configuration/alerting_rules/
规则示例
yaml
- name: ECS
  rules:
  - alert: CPU使用率大于90%
    expr: 100 - (avg(irate(node_cpu_seconds_total{mode="idle"}[5m])) by (instance,instance_id,job,instance_name,cloud) * 100) > 90
    for: 3m
    labels:
      level: 0
      key: alarm
    annotations:
description: "[{{ $labels.cloud }}]{{ $labels.instance }}; {{ $labels.instance_name }}; 当前值: {{ printf \"%.2f\" $value }}%"规则字段含义
alert: 警报名称expr: PromQL 表达式for: 可选,表示持续时长;只有在持续时间内一直处于告警状态,才会发送告警labels: 附加标签;可用于模板annotations: 信息标签,用于存储更长的附加信息;可用于模板
规则模板
$labels变量保存警报实例的标签键/值对$externalLabels变量保存配置的外部标签$value变量保存警报实例的评估值
使用代码示例:
yaml
{{ $labels.job }}
{{ $labels.instance }}
{{ $value }}
{{ printf \"%.2f\" $value }} # 保留两位小数如何新建一个规则
- 先确定 expr 语句
- 在 graph 页面测试 expr 语句
- 按照上述示例写好 rule 文件
- 使用 promtool 命令检测 rule 文件bash
go get github.com/prometheus/prometheus/cmd/promtool promtool check rules /path/to/example.rules.yml - 更新 prometheus 配置文件
- 重载 prometheus 配置:发送 SIGHUP 信号
kill -1 $PID
AlertManager
开始使用
- 安装并配置 Alertmanager
- 配置 Prometheus 使之连接 Alertmanager
- 在 Prometheus 中配置告警规则
具备的功能
- 通道静默
- 告警抑制
- 分组聚合
- 发送通知
发送消息
发送消息提供了很多种方式,咱们使用最灵活的 webhook 方式: https://prometheus.io/docs/alerting/latest/configuration/#webhook_config
配置文件示例
yaml
global:
  resolve_timeout: 5m

route:
  receiver: webhook
  group_wait: 30s
  group_interval: 5m
  repeat_interval: 5m
  group_by: [alertname]
  routes:
  - receiver: webhook
    group_wait: 10s
    match:
      team: node

receivers:
- name: webhook
  webhook_configs:
  - url: http://127.0.0.1/api/v1/notify/webhook/prometheus/
send_resolved: true重载配置
- 发送 SIGHUP 信号
kill -1 $PID - POST
/-/reload请求
告警信息结构体
webhook 方式接收的告警信息示例如下:
json
{
  "version": "4",
  "groupKey": <string>,              // key identifying the group of alerts (e.g. to deduplicate)
  "truncatedAlerts": <int>,          // how many alerts have been truncated due to "max_alerts"
  "status": "<resolved|firing>",
  "receiver": <string>,
  "groupLabels": <object>,
  "commonLabels": <object>,
  "commonAnnotations": <object>,
  "externalURL": <string>,           // backlink to the Alertmanager.
  "alerts": [
    {
      "status": "<resolved|firing>",
      "labels": <object>,
      "annotations": <object>,
      "startsAt": "<rfc3339>",
      "endsAt": "<rfc3339>",
      "generatorURL": <string>,      // identifies the entity that caused the alert
      "fingerprint": <string>        // fingerprint to identify the alert
    },
    ...
  ]
}- 重点关心
alerts列表字段,存储的是当前分组之后的所有告警列表 alerts.status为此告警的当前状态:firing告警触发resolved告警恢复
alerts.fingerprint为单个告警的唯一标识,它通过alerts.labels字段计算得来- 自定义的告警可通过如下方式计算得出
fingerprintpythonimport hashlib alert['fingerprint'] = hashlib.md5( str(sorted(alert['labels'].items())).encode('utf-8') ).hexdigest()
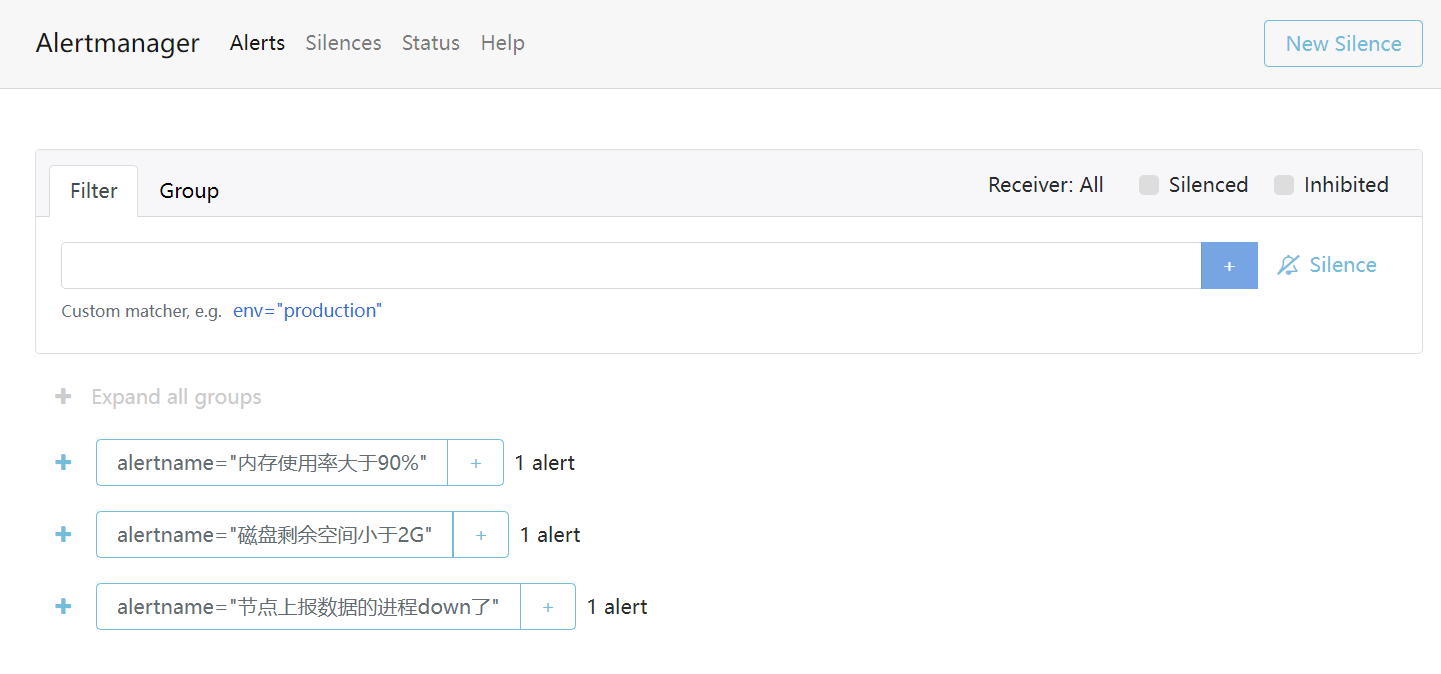
Alertmanager web 页面
Alertmanager 还提供了一个 web 服务,可在页面中查看到当前所有正在发生的告警,并可对告警进行屏蔽静默操作